Tag Archives: maps

Free eBook Friday: Mapping and Navigation

Mapping and Navigation: Explore the History and Science of Finding Your Way with 25 Projects, by Cynthia Light Brown:

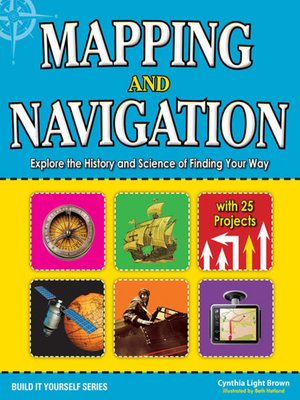
How did we get from 20-foot-long maps to GPS devices small enough to fit in the palm of our hands? How does GPS work and what can it tell us? How do ancient mapmaking techniques used by the Romans and Greeks influence the satellite technologies we use today? The history of mapmaking is full of remarkable characters who charted the unknown with an ever-changing set of tools. In Mapping and Navigation, kids ages 9–12 will learn the history and science behind the evolution of mapmaking, and how much is still out there for discovery.

Readers will explore ideas through hands-on experiments while learning new terminology and interesting facts. Projects include using triangulation to measure distances, creating contour lines on a mini-mountain to understand elevation changes on a map, and inventing a sundial and compass to understand the basics of navigation. Whether mapping the solar system or mapping their own backyard, all readers will be able to understand mapping technologies and see the world in new and exciting ways.

***

Every Friday, we highlight an eBook from our collection at
http://e-inc.lib.overdrive.com
.  Let us know what you think of these selections, and tell us about eBooks you’ve enjoyed – we may feature them here!

Resource of the Month: SimplyMap

SimplyMap


Are you interested in working with statistical data and geographical imaging systems?  SimplyMap can be a great resource to learn how to work with demographic data or to prepare maps and data tables for a research paper.

Although working with statistical data can be intimidating, SimplyMap has a great built-in tutorial wizard to help you.  Begin by browsing your options on the “I want to…” dropdown menu on the left, where you can choose to plot a map, compare statistical variables in a table, create a demographic analysis of an area, and more.  No matter which option you choose, the wizard walks you through every step using pop-up instructional boxes.

All statistics are provided by the U.S. Census Bureau and can be broken down by state, county, zip code, census tract, or block group.  There is a rich set of data to draw from, covering topics to satisfy any curiosity.  You could plot a map showing average household size of different neighborhoods in Chicago, or create a table showing which state spent the most money on hair care products in 2010!  Best of all, SimplyMap keeps all of your maps and tables open in separate tabs for easy back-and-forth comparison and allows you to export materials as PDF or GIF images, either as files or as emails.

To access SimplyMap, go to the NC LIVE homepage at www.nclive.org.  Under the category “Data & Demographics,” click the SimplyMap link (you will be prompted to enter your library card number outside of the library).  To begin using SimplyMap, create an account with your email address and password.  You may also log in as a guest, though you will not be able to save your work this way.  If you need help, don’t hesitate to ask a reference librarian to assist you.